


Press-room / news / Science news /
Scientists from IBCH RAS and their colleagues propose a way to tell reliable immune recognition data from faulty records
A T cell recognizes a diseased cell by a molecular “tag” on its surface, and which T cell receptor fits which tag now shapes the development of cellular cancer therapies, vaccines and diagnostics. The world’s databases collecting these matches have turned out to be less dependable than was assumed: an independent experimental screen confirmed only about half of their entries. Scientists from IBCH RAS and their colleagues have shown how to tell sound records from faulty ones — and that the situation is markedly better than it might have seemed. The work is published in Nature Methods.
A lock, a key, and the immune system’s card index
T cells are the immune system’s patrol. Each carries a unique receptor on its surface and roams the body in search of the one molecular target that fits it: a fragment of a viral protein, a tumour antigen or, in autoimmune disease, one of the body’s own molecules. Once the cell finds its target, it launches an immune response.
Compiling a card index of these matches is one of the central tasks of modern immunology. Knowing which receptor recognizes a given antigen makes it possible to track the response to an infection or a vaccine, to find and expand the right cells to treat a tumour, or to pick a target for a cancer vaccine. In recent years such pairs have been gathered into databases now numbering hundreds of thousands of entries; one of the largest, VDJdb, is developed by the authors of this work.
But the card index has a weak point. Truly conclusive proof — a solved three-dimensional structure of the receptor bound to its target — exists for only a few hundred pairs, roughly five hundred times rarer than the database entries themselves. Checking every record against a gold standard is impossible, so confidence has to be assessed statistically.
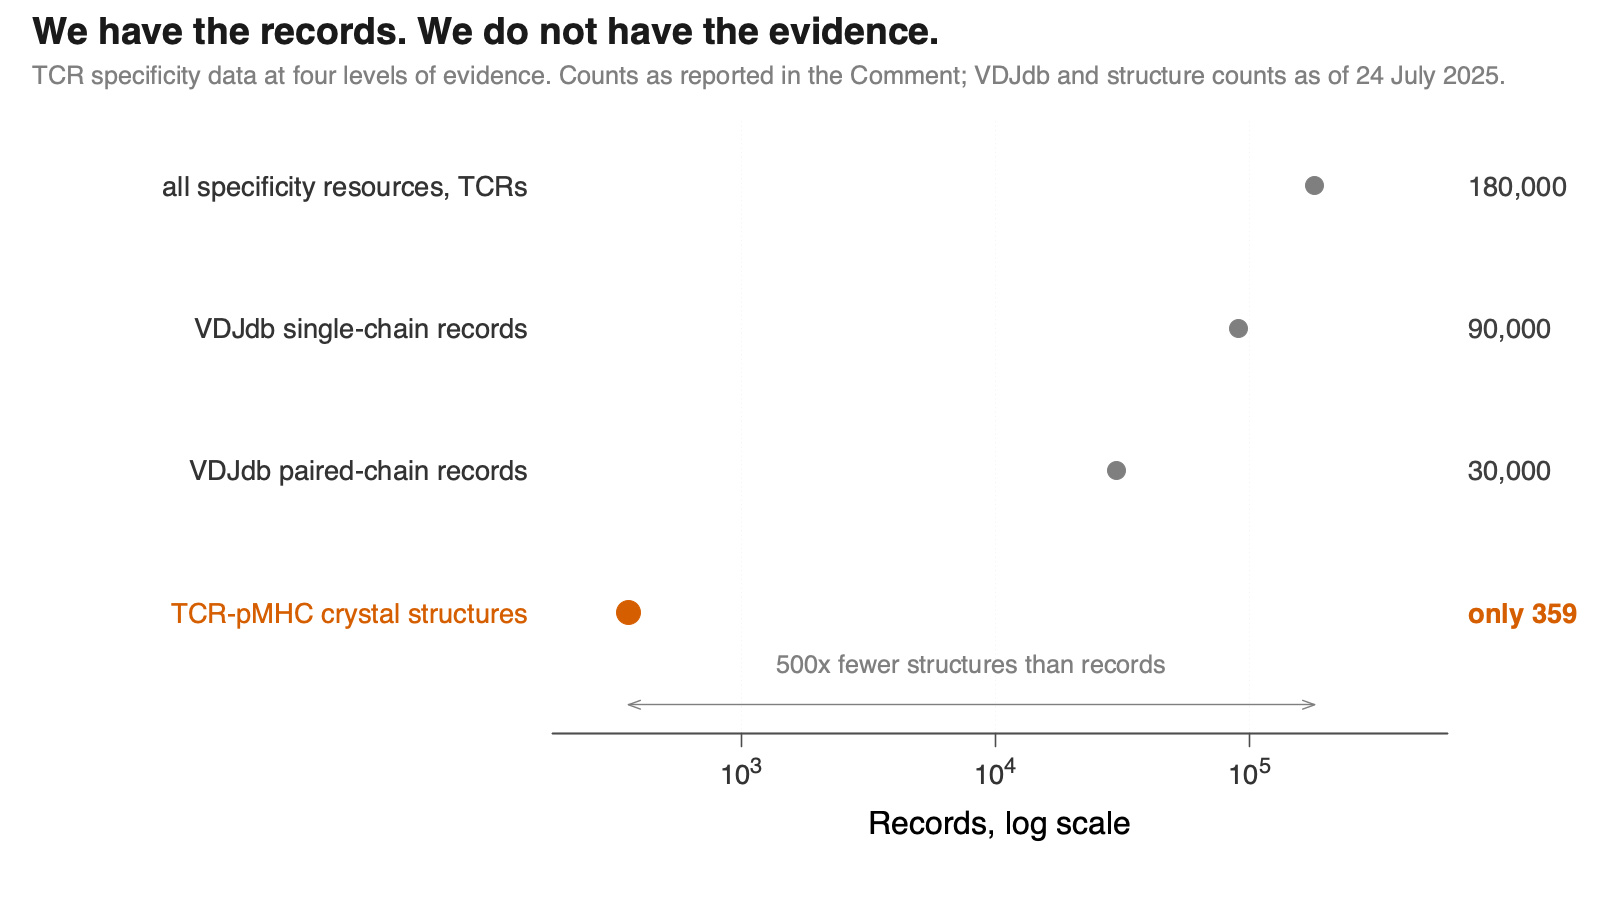
Figure 1. T cell receptor specificity data at four levels of evidence: about 180,000 receptors across all resources, against 359 solved three-dimensional structures of the complexes (as of 24 July 2025). Logarithmic scale.
Where the missing half comes from
Errors enter these databases not through carelessness but through the arithmetic of the experiment itself. To find the cells that recognize a given target, researchers fish them out of blood using cell sorting instruments. The method is good but not perfect: along with the cells of interest, a small fraction of bystanders inevitably ends up in the tube — typically between half a percent and one percent.
Then a statistical trap springs shut. A genuine immune response is narrow: a limited set of cell clones answers any one target, and the same receptors turn up in the sample again and again. The contaminating cells, by contrast, are drawn from the general pool, where almost every cell carries its own one-off receptor. As a result, a handful of stray cells generates several times more distinct variants than the entire true response — and up to half of the unique records may be spurious.
This is precisely the picture revealed by a recent large-scale screen in which database entries were re-tested on a robotic platform.
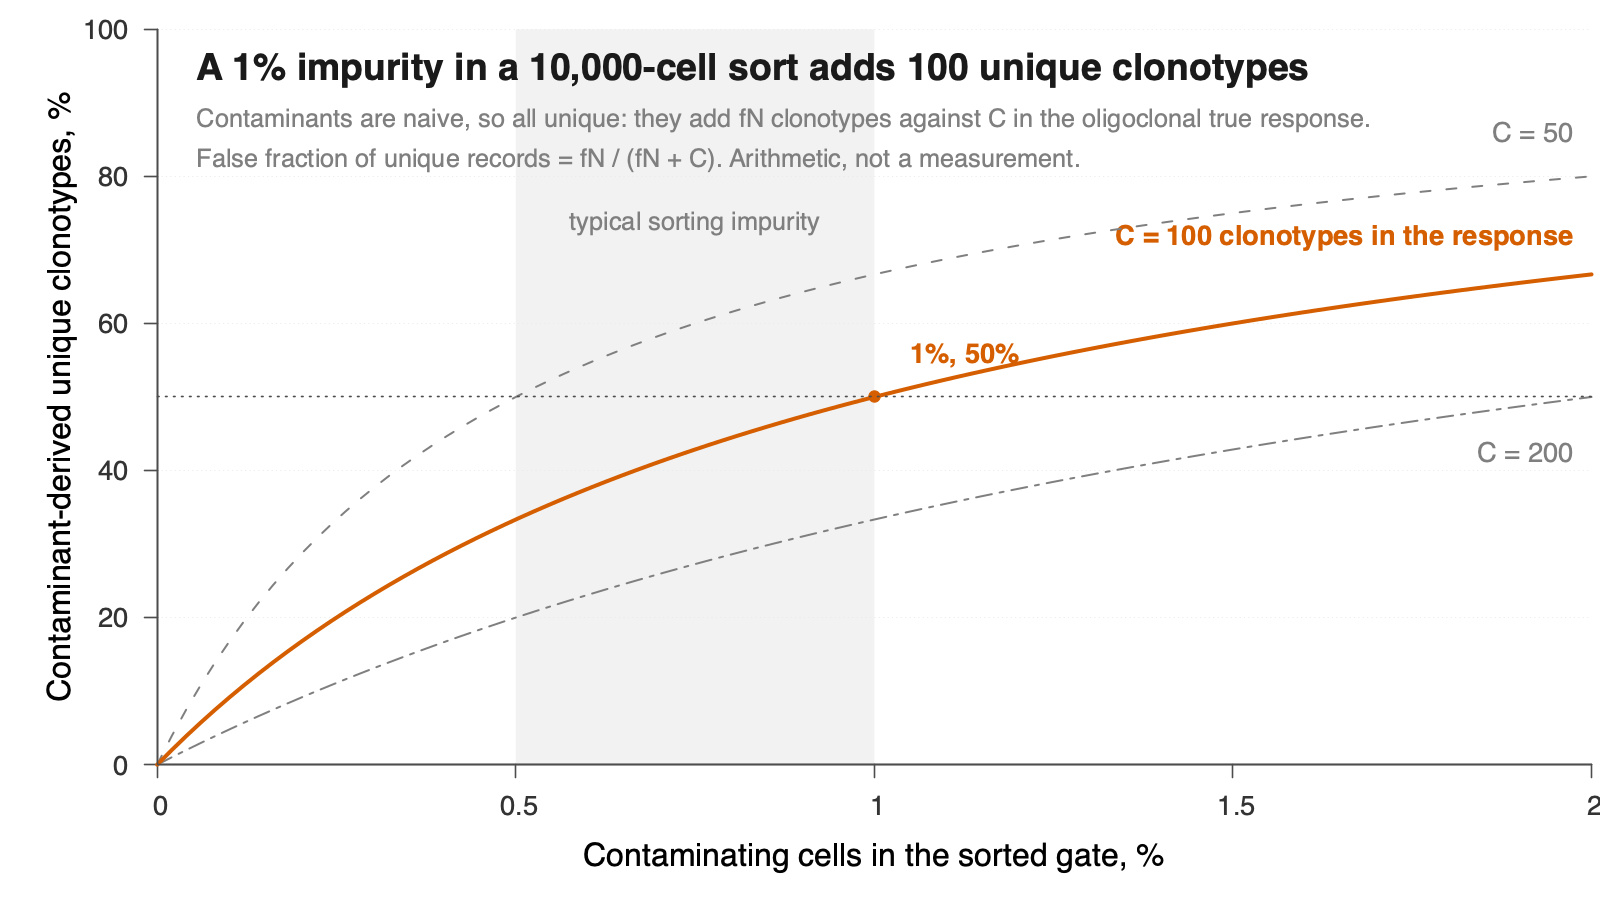
Figure 2. The fraction of spurious unique variants rises with the impurity in the sorted fraction. The grey band marks the impurity level typical of cell sorting. Spurious records arise systematically, and can therefore be accounted for statistically.
Repetition is not proof
An obvious remedy suggests itself: trust the records that independently turn up in several studies. The authors have shown that this does not work.
Some receptors are “public”: they are built in a way that the body assembles particularly easily, so nearly everyone has them. Such a receptor will surface in study after study regardless of whether it recognizes the target it has been assigned. Here, repetition speaks to the architecture of the genome, not to the reliability of the result.
There is an even clearer warning sign. Taken at face value, the databases claim that certain receptors recognize a dozen different targets at once. Such promiscuity is biologically all but impossible: a cell with so indiscriminate a receptor would not survive selection in the thymus, where T cells learn not to react to thousands of the body’s own proteins. What we are looking at, then, is an artifact rather than a phenomenon.
The authors’ conclusion is that the problem must be framed differently. Not counting confirmations, but filtering out noise.
The handwriting of a genuine immune response
A genuine immune response leaves recognizable handwriting. Receptors from different people that recognize the same target resemble one another — evolution arrives at a similar solution again and again. Such a family of similar receptors forms a motif, a kind of photofit of the response to a particular antigen.
The difficulty is that similar receptors also arise on their own, with no selection involved: the machinery that assembles them makes some variants often and others almost never. Mistaking this background similarity for a sign of shared specificity is all too easy.
The TCRNET method, proposed by the authors back in 2019, subtracts that background and retains only those families that chance cannot explain. In the new work it is for the first time assigned the role of a mandatory filter for the entire database — a step to be taken before predictive models are ever trained on the data.
Most convincingly of all, the handwriting does not fade with time. Four motifs for one of the coronavirus targets, described by the authors in 2022, are still assembling from the data of independent laboratories three years on. The largest of them draws on the work of 28 research groups.
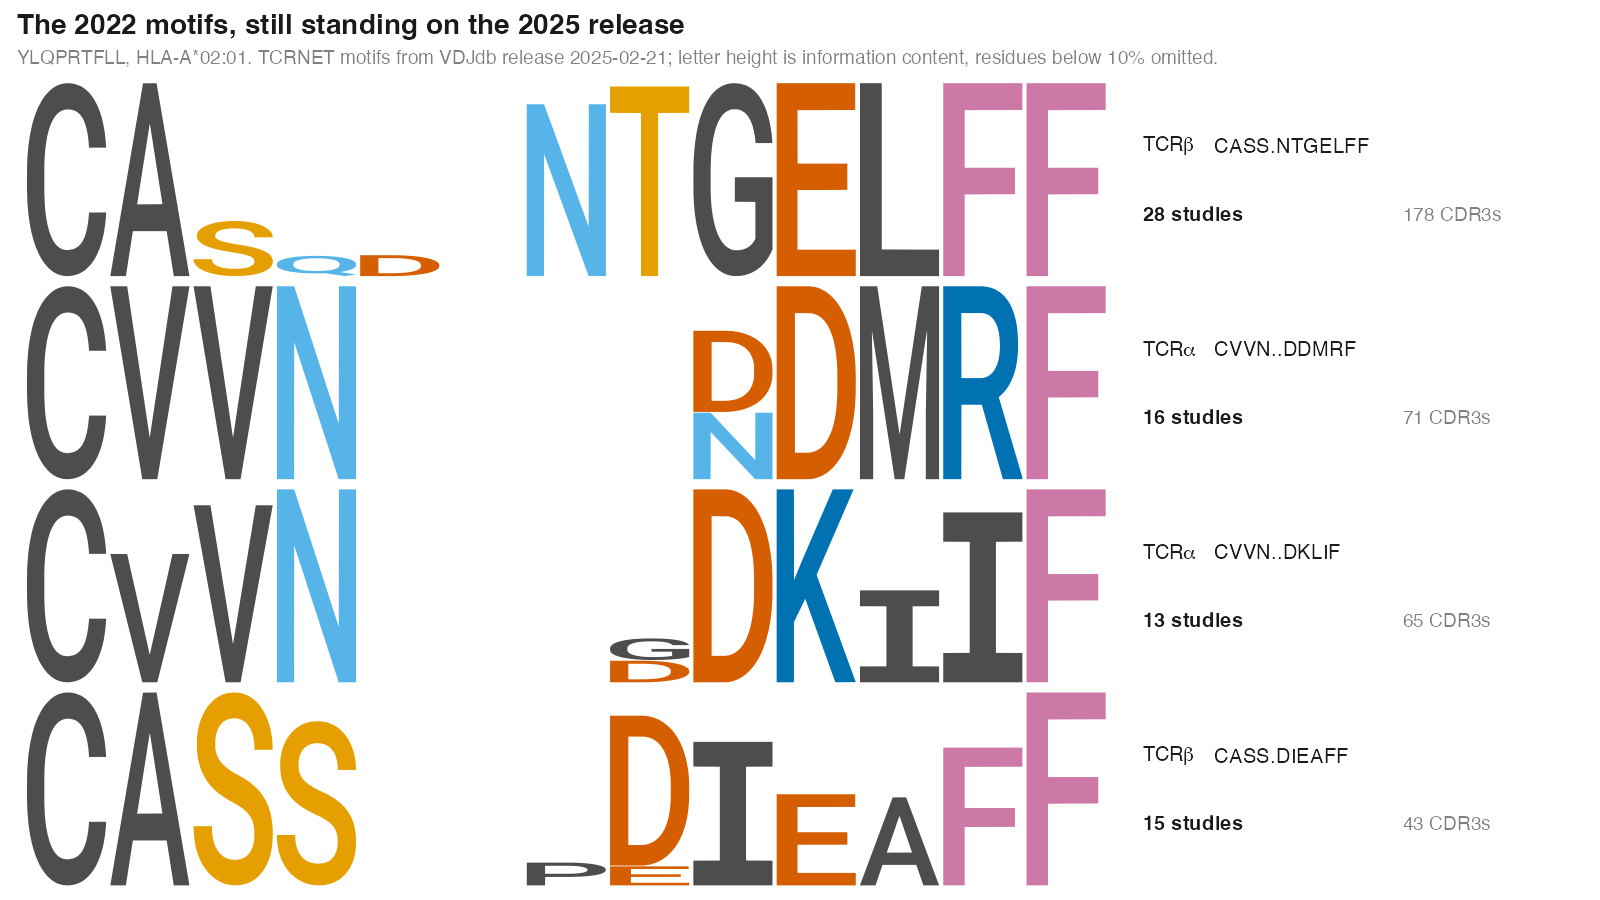
Figure 3. Four TCRNET motifs for the SARS-CoV-2 epitope YLQPRTFLL, from VDJdb data as of February 2025. Letter height reflects how strictly the position is fixed. Listed at right for each motif: the receptor chain, the consensus, the number of independent studies and the number of sequences.
A sevenfold gain
The filter could be put to the test thanks to an independent experiment: colleagues of the authors re-examined some 1,700 entries for two viral targets on a robotic platform, knowing nothing of the results of the computational analysis.
The agreement was striking. Records that fell inside a motif validated experimentally in 81% of cases; those that did not, in 38%. The odds of independent confirmation are seven times higher for the filtered records.
Two entirely different approaches — sequence statistics on a computer and living cells in the laboratory — converged on the same set of entries. In a field where a reliable gold standard is all but absent, that is the strongest argument available.
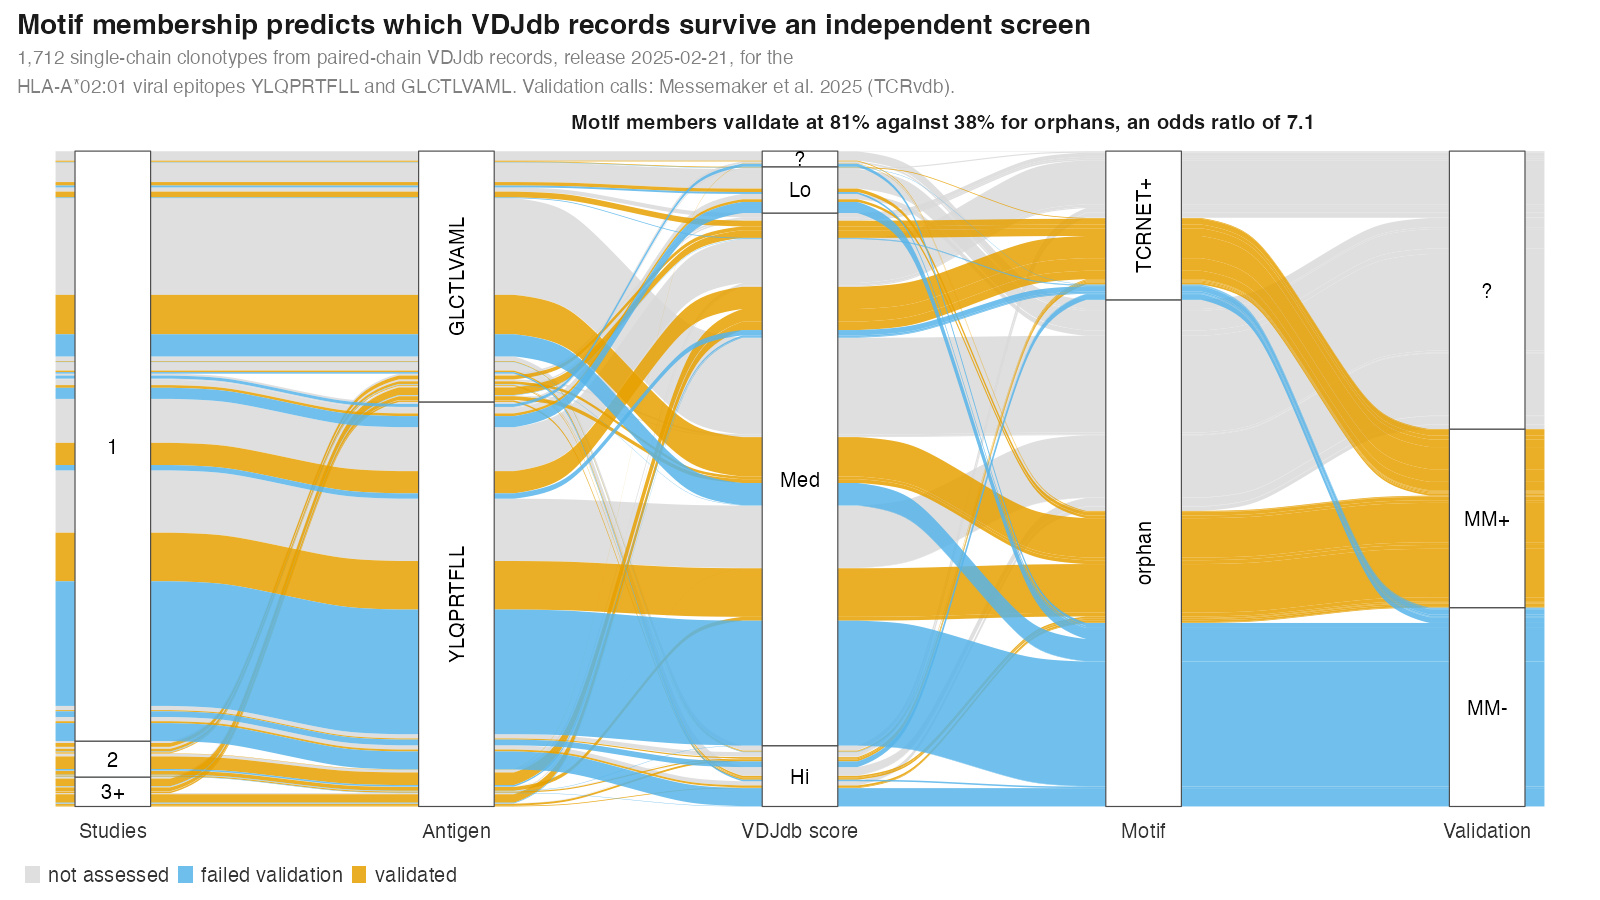
Figure 4. The fate of database records: from the number of studies and the antigen through to the confidence score, motif membership and the outcome of independent validation. Orange marks confirmed records, blue those that failed, grey those not assessed.
The good news
Here is where the new work departs from merely restating the problem. The immune system’s card index turns out not to be half spoiled at all.
First, most of the confirmed records lie outside the motifs. The filter isolates a core of heightened reliability without devaluing the rest: a great many genuine receptors remain beyond it, including rare high-affinity variants that by their nature form no families. Filtering should therefore be applied for precision, where the cost of an error is high, rather than to shrink the database.
Second, a substantial share of the “failed” checks — up to a third — has nothing to do with the receptor failing to recognize its target. A T cell receptor is made of two chains, and in the data these are not infrequently joined up incorrectly; imprecise assignment of the genes the receptor is built from skews the result in much the same way. These are annotation errors rather than biology, and they are fixable — what is needed is an extra check on how the chains are paired and careful data reporting to the standards the field has agreed.
Third, filtering brings an unexpected bonus. The databases are heavily skewed: almost half of all records concern a single common tissue-compatibility variant, simply because it is the most convenient to study. Such a skew keeps machine learning models from coping with the rest of the diversity. Collapsing records into motifs removes the redundancy and cuts the skew by more than half, leaving a compact, balanced dataset that models can actually be trained on.
A second filter: artificial intelligence
There is also an independent way to check a record. Models that predict the three-dimensional structure of proteins can assemble a receptor together with its target and report how confident they are in the resulting construction.
That confidence alone, it turns out, is enough to tell genuine pairs from false ones — even though the model was never trained on which receptors bind and which do not. It simply “sees” that for false pairs the complex does not come together.
The value of such a filter lies in its independence: it rests on three-dimensional structure rather than sequence statistics, and so it fails in different ways. Two independent filters agreeing on one record inspire far more confidence than either alone. The same principle already works in other hands: an algorithm developed by the authors’ collaborators on the screen successfully predicts which records will survive laboratory testing.
The need for such filters is keenly felt. In open specificity prediction competitions, the accuracy of the best models has for several years failed to rise appreciably above 60%, and the authors put this down first and foremost to the quality of the input data: garbage in, garbage out.
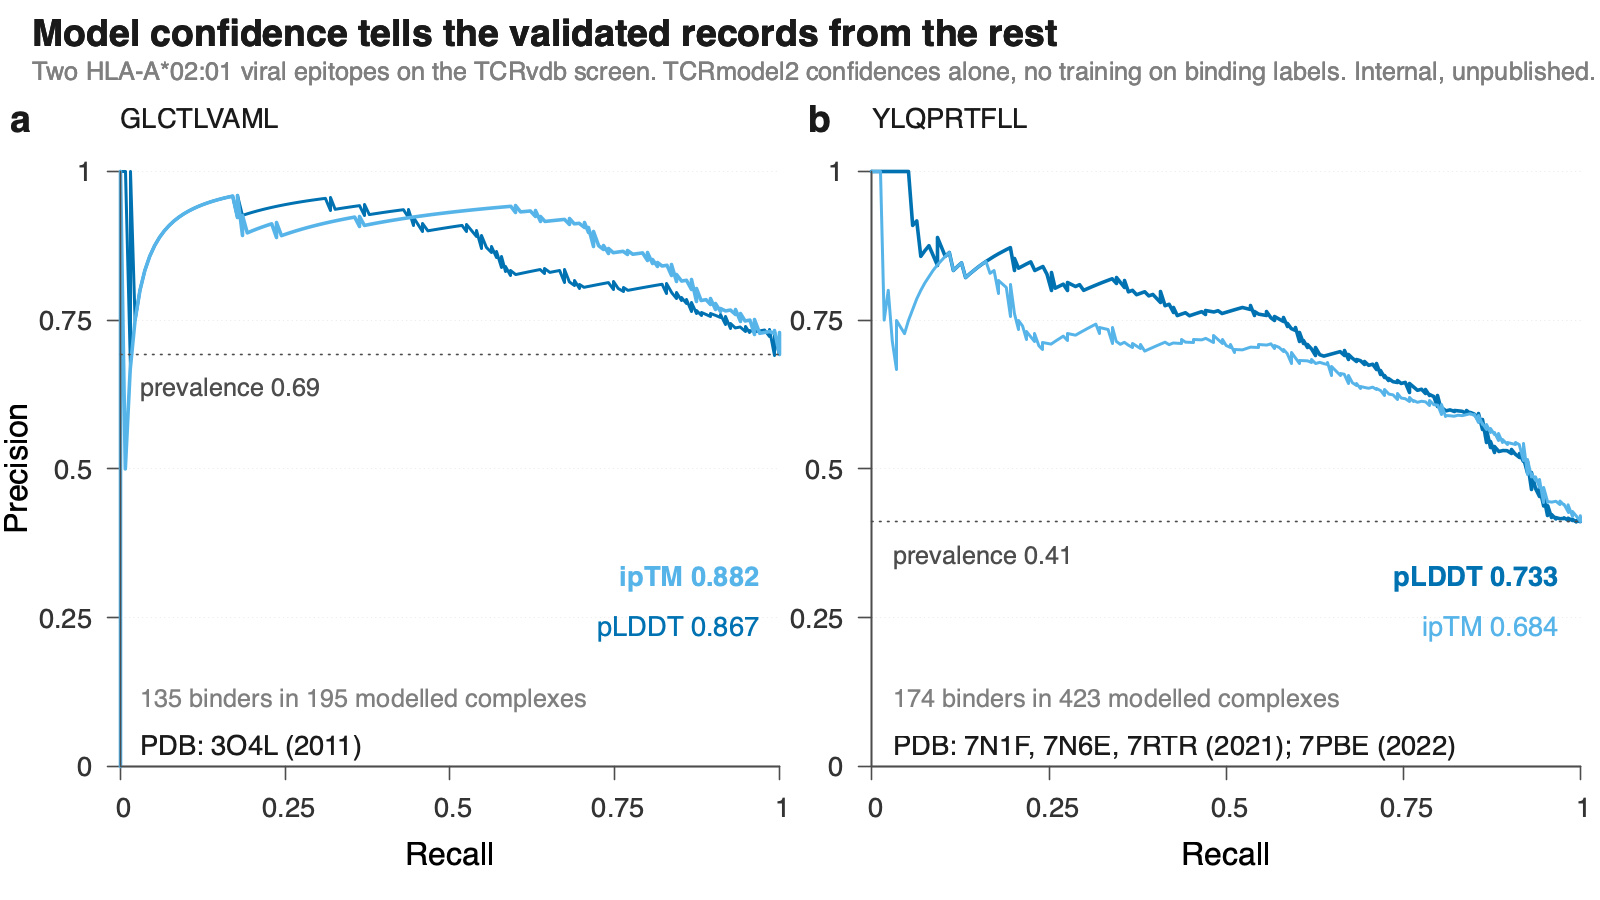
Figure 5. The structural model’s confidence separates binding receptors from non-binding ones on two viral targets. The dotted line marks the level that random guessing would give. Unpublished data from the authors.
Lab in the loop
Taken together, these pieces form a working cycle the authors call lab-in-the-loop. The statistical filter and the structural model select the most plausible records, a robot tests them on living cells, and the result feeds back into the model and into the database. The next round begins with cleaner data and a sharper model. Unlike a one-off check, such a cycle improves the whole card index gradually and without pause — and it works not only for receptors described previously but for those designed on a computer.
Negative results acquire a particular value in this scheme. Models today badly lack dependable examples of what does not bind, and made-up ones are used instead — with the result that the model learns to recognize the invention rather than the biology. Robotic testing yields genuine negative results as a by-product, and such data are invaluable both for training and for judging models fairly.
The central message of the work is to restore the norm of independent confirmation to the field. Neither a statistical filter nor artificial intelligence delivers a final verdict: they sharply improve the odds and save effort by pointing to what should be tested first. The last word belongs to experiment. What the authors show is that this combination can now genuinely be built — and that the data underpinning the immunotherapy of the future can be far more reliable than they are today.
Publication: Shugay M, Luppov DV, Vlasova EK, Chudakov DM. Towards high-quality large-scale T cell receptor antigen specificity data: challenges and promises. Nature Methods (2026). DOI: 10.1038/s41592-026-03227-2
Data and code: https://github.com/antigenomics/vdjdb-db-validation
VDJdb database: https://vdjdb.cdr3.net
september 22