
Press-room / news / Science news /
A Single Fluorescent Protein-Based Indicator with a Time-Resolved Fluorescence Readout for Precise pH Measurements in the Alkaline Range
The real-time monitoring of the intracellular pH in live cells with high precision represents an important methodological challenge. Although genetically encoded fluorescent indicators can be considered as a probe of choice for such measurements, they are hindered mostly by the inability to determine an absolute pH value and/or a narrow dynamic range of the signal, making them inefficient for recording the small pH changes that typically occur within cellular organelles.
The team of scientists from the Laboratory of genetically encoded molecular tools IBCh RAS studied the pH sensitivity of a green-fluorescence-protein (GFP)-based emitter (EGFP-Y145L/S205V) with the alkaline-shifted chromophore’s pKa and demonstrate that, in the pH range of 7.5–9.0, its fluorescence lifetime changes by a factor of ~3.5 in a quasi-linear manner in mammalian cells. Considering the relatively strong lifetime response in a narrow pH range, authors proposed the mitochondria, which are known to have a weakly alkaline milieu, as a target for live-cell pH measurements. Using fluorescence lifetime imaging microscopy (FLIM) to visualize the HEK293T cells expressing mitochondrially targeted EGFP- Y145L/S205V, scientists succeeded in determining the absolute pH value of the mitochondria and recorded the ETC-uncoupler-stimulated pH shift with a precision of 0.1 unit. Thus it was shown for the first time that a single GFP with alkaline-shifted pKa can act as a high-precision indicator that can be used in a specific pH range.
The work is published in the International Journal of Molecular Sciences.
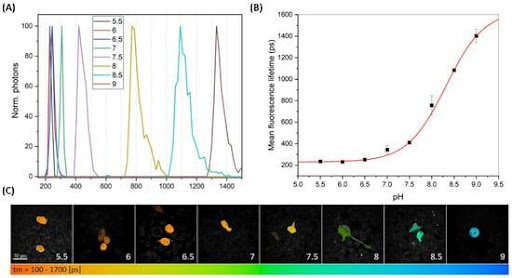
Figure 1. FLIM data recorded from the monensin/nigericin-penetrated HEK293T cells expressing EGFP-Y145L/S205V, pre-incubated with pH buffers (pH 5.5–9.0). (A) Histograms showing the mean lifetime distribution calculated from the FLIM scans at different pH values (color legend is in the inset). (B) The graph describing the dependence of the mean lifetime on the pH. (C) Color-coded FLIM scans exemplifying the lifetime values recorded in the cytoplasm of the HEK293T cells (color legend is under the image gallery). Scale bar is 30 µm. A two-photon (2P) laser, λem = 750 nm, was used for the fluorescence excitation.
november 17, 2022