
Press-room / news / Science news /
How the fluorescent nanoclusters look like
Our new article “Albumin-stabilized fluorescent metal nanoclusters: fabrication, physico-chemical properties and cytotoxicity” was recently published in Materials and Design journal. The work was performed by a team of authors from the Scientific Clinical Center for Physico-Chemical Medicine, Moscow Institute of Physics and Technology and IBCh RAS. The researchers of the Electron microscopy group of our institute carried out an important part of the work on direct visualization of the obtained structures, as well as on the measurement of energy dispersive X-ray spectra.
, Obraztsova EA, , , , , Klinov DV
Metal nanoclusters, consisting of several tens of metal atoms and having a size of less than 2 nm, are a promising material due to their unique optical properties that appear due to the splitting of electron energy spectrum in metal into discrete energy levels as a result of quantum-size effects. Such a system exhibits properties similar to molecules, such as fluorescence and has interesting electrical and magnetic properties. However, due to the high surface energy, nanoclusters quickly aggregate into larger particles and require stabilization. In this work, nanoclusters were synthesized using the protein-stabilizing method, where the protein can simultaneously act as both a reducing and stabilizing agent. The synthesis procedure was optimized to obtain nanoclusters from various metals (suspensions of gold and cadmium nanoclusters are shown in Figure 1) stabilized with bovine serum albumin.
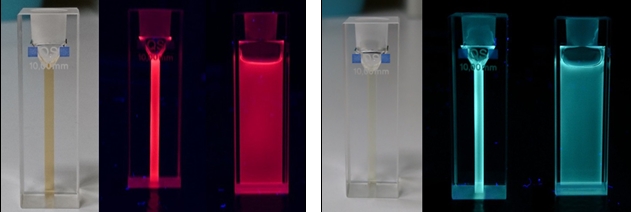
Fig.1. Images of suspensions of gold (left) and cadmium (right) nanoclusters in daylight and under a UV lamp.
A number of indirect measurements were performed to estimate the size of the resulting clusters, such as mass spectroscopy, energy dispersive X-ray spectroscopy, etc., which showed that gold nanoclusters consist of 10-15 atoms, and cadmium ones - of 25-40 atoms. In order to confirm the results of these measurements, it was necessary to visualize metal nanoclusters. Which was done using transmission electron microscopy. The task was complicated by the very small particle sizes, as well as the fact that they are surrounded by protein. These factors reduced the contrast of the resulting images. In order to obtain a statistically significant amount of sufficiently contrast images of nanoclusters, both standard electron microscopy methods and new approaches, where we employ nanostructured substrates, were used. Figure 2 shows the obtained images of nanoclusters and diagrams of its size distribution.
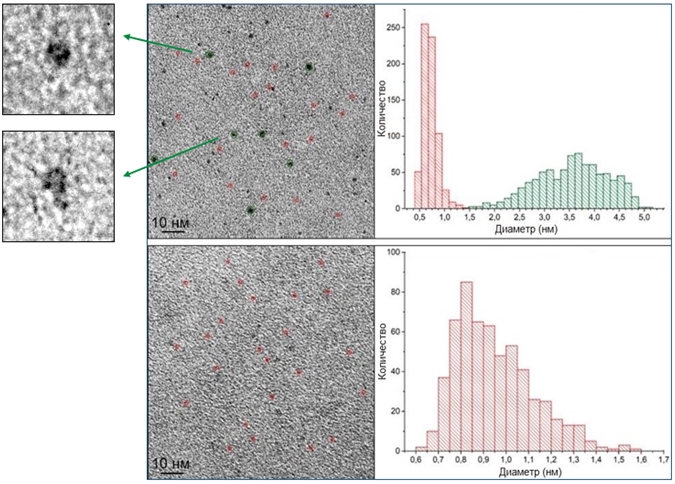
Fig.2. TEM images and size distribution diagrams of gold (top) and cadmium (bottom) nanoclusters.
may 29, 2020